Evaluating Classification Models Using Accuracy, Precision, Recall, and More
When using machine learning to solve a classification problem, such as spam detection and fraud detection, it is essential to measure the model's performance to see how well the model solves the problem. We can use a variety of metrics for this, with the most common being accuracy, precision, recall, sensitivity, specificity, and F1 score.
In this article, we will explore these metrics and how to use them to evaluate your model.
Confusion Matrix
Before we explore the metrics, we first need to discuss how we label a correct prediction. We can use the "confusion matrix" to help us understand this. The confusion matrix is a table that shows the number of correct and incorrect predictions made by the model compared to the actual outcomes.
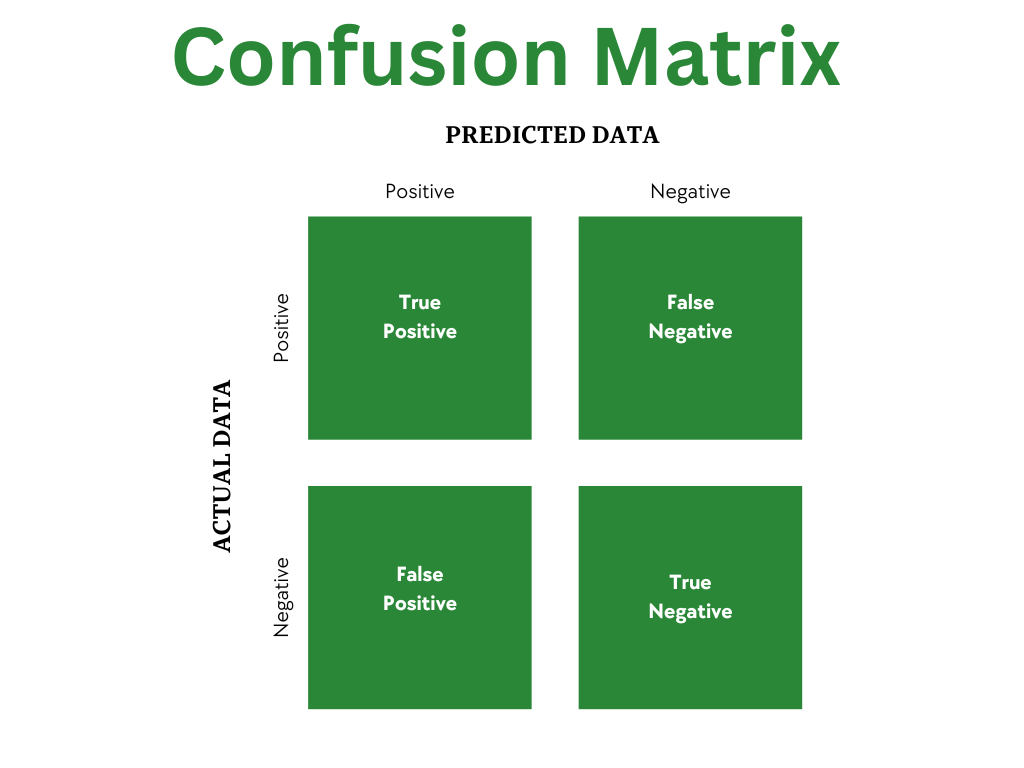
Along the side of the matrix, we have the actual outcomes. For example, this could be "spam" and "not spam" for spam detection — though this is usually labeled positive and negative in most evaluations. Along the top side of the matrix, we have the predicted values, generally labeled as positive and negative. The four created cells give us the four categories of predictions:
- True Positive (TP): The model correctly predicted the positive class. For example, if the item was spam and the model predicted it to be spam, it would be a true positive.
- False Positive (FP): The model incorrectly predicted the positive class. For example, if the item was not spam and the model predicted it to be spam, it would be a false positive. In medical models, this would be called a Type 1 error, where the model predicted that the healthy patient was sick.
- False Negative (FN): The model incorrectly predicted the negative class. For example, if the item was spam and the model predicted it to be not spam, it would be a false negative. In medical models, this would be called a Type 2 error, where the model predicted that the sick patient was healthy.
- True Negative (TN): The model correctly predicted the negative class. For example, if the item was not spam and the model predicted it to be not spam, it would be a true negative.
Metrics
To calculate our various metrics, we collect the total number of each of these prediction categories. For example, if we had 1000 items in our dataset, we could have 300 true positives, 100 false positives, 50 false negatives, and 550 true negatives. We can then use these numbers to calculate our metrics.
Accuracy
Accuracy is the most common metric used to evaluate a model. We calculate accuracy by dividing the number of correct predictions by the total number of predictions.
For example, if we had 1000 emails in our dataset and our model correctly predicted whether each email was spam or not spam 900 times, our accuracy would be 90% (900/1000).
While this may seem straightforward, accuracy can be misleading when dealing with datasets that only have small amounts of positive cases. For example, let's say we had 10,000 patients, where ten were sick. If we built a model that assumes all patients are healthy, we would correctly predict the healthy patients 9990 times and incorrectly predict the sick patients ten times, which gives us an accuracy of 99.9%. While this is a high accuracy, it is not a good model as it does not predict any of the sick patients.
Precision
Precision is the number of true positives divided by the number of true positives plus the number of false positives. It is a measure of how many of the positive predictions were actually correct.
A good way to remember precision is that it answers the question, "Out of all items the model predicted to be positive, how many actually were positive?".
If the cost of a false positive is high, then we want to have a high precision. For example, let's say we are creating tests for detecting cancer. We might have an initial screening test for those who might have cancer. We then have a second test that detects cancer and, if it returns a positive result, we recommend invasive procedures such as chemotherapy or surgery. In this second test, we want to have a high precision as we don't want to go down the path of these invasive procedures for patients who don't have cancer.
Recall (AKA Sensitivity)
Recall — in medical models, this is often labeled as Sensitivity — is the number of true positives divided by the number of true positives plus the number of false negatives. It is a measure of how many of the actual positive cases were correctly predicted.
A good way to remember recall is that it answers the question, "Out of all items that are actually positive, how many were correctly predicted to be positive?".
F1 Score
We often want a single metric that can tell us how well our model is performing while also taking into account both precision and recall. This is what the F1 score (and the F-beta score) does.
In math, there are different types of mean. If we used the arithmetic mean — what most people think of when we say "mean" or "average" — we would put equal weight on precision and recall. If we had two models, one with 100% precision with 24% recall and one with 60% precision and 58% recall, the first model would have an arithmetic mean of 62% while the second model would have an arithmetic mean of 59%. However, we would probably want to use the second model as it has a better balance of precision and recall.
Instead, we use something called the harmonic mean. This works similarly to the arithmetic mean except that it leans more towards the lower number, i.e., a much worse value will pull down the second value more. So, the same two models above would instead have a harmonic mean of 38.7% and 58.9%, respectively. This shows that the second model is more balanced with higher values than the first model.
F-Beta Score
The F-beta score is a generalization of the F1 score that introduces a parameter (beta) that allows us to control how much weight we put on precision versus recall. The F1 score is the same as the F-beta score when beta is 1.0.
When beta is less than 1.0, we put more weight on precision. When beta is greater than 1.0, we put more weight on recall. This helps us to create a single, balanced metric with more weight on the metric we might care about more.
Specificity
Specificity is more common in medical models. It is the number of true negatives divided by the number of true negatives plus the number of false positives. It is a measure of how many of the negative predictions were actually correct.
A good way to remember specificity is that it answers the question, "Out of all items that are actually negative, how many were correctly predicted to be negative?".
Next Steps
For most models, you will want to use a combination of these metrics to evaluate your model.
Most of the time, when I am just starting to explore training a new model, I will print out the accuracy, precision, recall, and F1 score to begin with. As I continue to refine the model, I may switch to an F-beta score, depending on our objectives. For reporting to non-technical stakeholders, I will often use precision and recall without calling them that, but rather, answering the questions that they represent.
As you continue working with these metrics, you will want to:
- Identify how to make these calculations in the frameworks you are using. Some, like scikit-learn, have built-in functions for these calculations.
- Identify the objectives of the models you are working on and the cost of false positives and false negatives.
- Identify different ways to report these metrics to different types of stakeholders.
Similar Articles
Removing Stop Words Using Python
Working with text data for analysis or machine learning? You probably will need to remove stop words. Learn how in this article!